A dataset is useless unless our customers can access it and understand it. At SatSense we take great pride not only in the quality of our InSAR data, but in how easily our customers can access the information they need, and with the support of our technical team extract the most value from it.In this article, our developer Mike talks us through his thought process during the creation of our online data portal where our basic dataset (showing measurement point coverage, point velocities and time series) can be viewed. We will soon be covering the various ways in which customers can access our raw data in its various formats as well as the tailored datasets we have been developing. The snapshot below gives you an insight into the data density that SatSense offers. You can see clusters of dots (or "InSAR pixels" as we'll call them) each of which represent an area where SatSense has ground movement data. We've coloured each InSAR pixel with its velocity, which is calculated from a time series of 200+ points in time. This results in SatSense having to store quite a lot of data!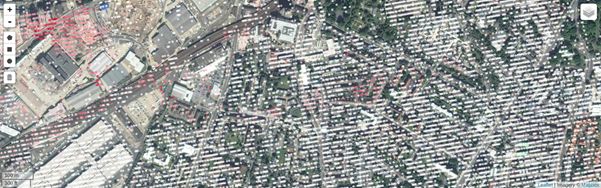
A few of our InSAR pixels
At the time of writing, SatSense has around 680 million InSAR pixels in our UK database. Counting each pixel's time series, our UK database houses about 260 billion time series data points. If we stored these time series data points as 4-byte floats, that's nearly a Terabyte without storing anything else. You can do a lot with that sort of disk space, and we've chosen to store subsidence data.
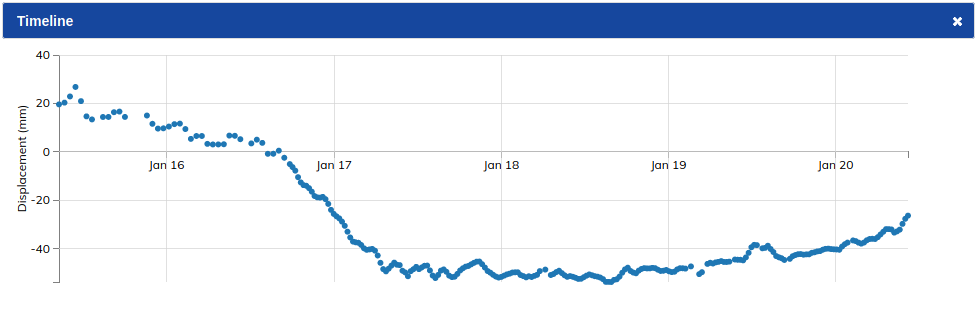
A time series of one of our InSAR pixels
By definition, this data is useless if no one can use it. We want to make our data accessible to everyone and we see our portal as the natural first step to what we can offer. Bespoke web maps are becoming ever more prevalent over heavier desktop solutions, and we want to be able to deliver solutions to teams without GIS experts as much as those with. When considering how to represent SatSense data in the portal, as a minimum we were looking for: 1. spatially rendered pixel properties (e.g. velocities) 2. spatial queries that could grab an InSAR pixel's time series very quicklyRendering Pixel Properties We seriously considered storing our data in MongoDB and taking advantage of its ability to store geospatial data. Storing InSAR pixels in a document-oriented database made a lot of sense to us; pixels didn't require knowledge outside the information of their own time series and derived data, and the lack of schema was attractive. However, we couldn't ignore the flexibility of working with PostGIS. Whilst big open source projects like Geoserver can tap into a spatially enabled MongoDB database, we found that some open source solutions didn't include default plugins. In particular, we use a lightweight tile server wrapping mapnik which we found much easier to integrate with PostGIS. By default, our tile server would try to render the velocities of all the InSAR pixels within the requested tile. If the tile zoom level was low enough this was clearly going to be a bottle neck – even if we tried to aggregate velocities on the fly. Our decision was to aggregate the velocities before run time. We tried several options, but our solution involves taking a rasterized version of averaged velocities and storing the results as Cloud Optimized Geotiffs (COGs). These geotiffs are organised so that you can quickly retrieve the bits of the geotiff that you need regardless of how big the overall geotiff is. For us, COGs are particularly exciting because we will soon be adding new derived data layers into the SatSense portal which are in a rasterized format. Spatial Queries Using a PostGIS-enabled database also meant that we can easily write queries that select time series for pixels within or near a geometry. However, there can be a couple of niggles to smooth out. For example, if you try to run the code equivalent of the following pseudo-code: >> Find me the time series for the nearest InSAR pixel to a longitude and latitude; then PostGIS can decide to try to order a large number of geometries so that it knows which is the closest. With 100s of millions of geometries in our database, this kind of query got extremely slow for us. On the other hand, PostGIS is very quick at handling queries like: >> Find me all of the pixels within x metres of a longitude and latitude; for small enough x. Therefore, a standard trick is to query for pixels within a few hundred metres to your longitude and latitude and then pipe those results to find the actual closest pixel (and hence obtain the time series). Have a look at our demo portal or request access to our full UK portal. We'll soon be adding more layers to our portal and be releasing new ways to access our data. Thanks for reading, MikeIf you would like to discuss the suitability of InSAR for your project, please don't hesitate to email us at contact@satsense.com.