Using pattern-spotting and machine learning to identify pipe failures
Water utilities have extensive underground pipe networks to maintain and repair. Burst pipes are costly ranging from tens of thousands to millions in repairs, compensation and Ofwat performance penalties. SatSense has worked with Severn Trent Water and Northumbrian Water to integrate ground movement data into their workflow for both short-term operational decisions and long-term strategic decision-making. Budget constraints only allow a replacement rate below 1% per year with strategic maintenance decisions primarily based on network properties. As ground movements correlate with pipe failures, we have conducted a successful feasibility study which utilises our InSAR data derived metrics to improve pipe failure predications by 40% (Figure 1).
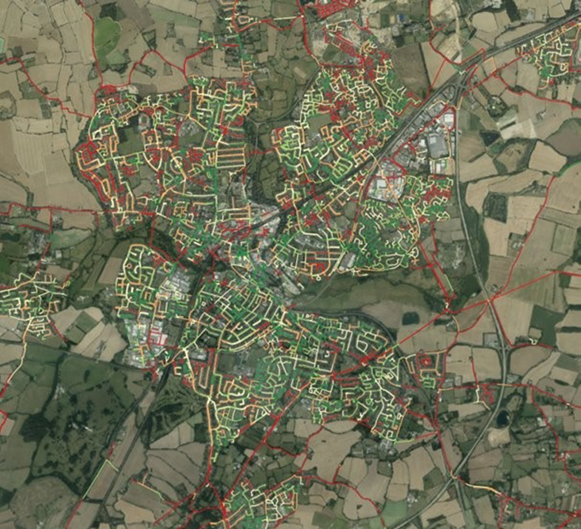
Example of SatSense data mapped onto a town's water pipe network, highlighting pipe sections most at risk of failure due to ground movements. Red denotes highest risk, green lowest. SatSense ground movement data covers urban areas, where most water infrastructure is located, particularly well. The movement measurements are updated frequently and measurements are available at or below property level. No other measurement technique can match the spatial scale, precision, and cost effectiveness.
The potential cost saving of including SatSense's ground movement data has led to support for the continuation of our project to a market ready service by both existing partners alongside an additional water utility (Yorkshire Water) and contractor (Arcadis). The ESA has approved our business case for the DRIPIN (Determining Risk of Pipe Failure using InSAR) project.
To obtain the greatest predicative power from our ground movement data, SatSense examined a multitude of metrics (Figure 2) using receiver operating characteristic curves. An area under the curve (AUC) value greater than 0.5 implies a degree of predictive power whilst a value of 1 is always correct. Combining multiple metrics using machine learning improved the AUC to 0.88 and enabled the production of classification probabilities for any individual pipe bursting.
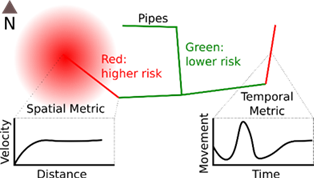
Examples of how different risk metrics assign pipes a risk value. The blurred, red circle shows an area experiencing subsidence detected by one metric whilst the red pipe at the right of the image has not undergone much permanent movement but has experienced significant fluctuations in the past, requiring a different detection metric.
Integration of SatSense's metrics into existing water utilities risk modelling improved the performance of their models, particularly at very low percentage levels. Northumbrian Water observed model performance improvements of 23 - 46 % at pipe replacement percentage lengths they were interested in (Table 1). These large improvements at very low percentage lengths indicate InSAR data is very useful at prioritising maintenance activities.
Cumulative Length (approx. %)
Improvement
7km (0.1%)
46%
35km (0.5%)
40%
1%
23%
Percentage improvements related to the increase in number of bursts identified when using SatSense data in the risk model Vs not using SatSense data, for three typical replacement length. Cumulative length refers to the length of pipe replaced in a year
In addition to the predicative power for improving long-term strategic decision-making, the feasibility of integrating SatSense's ground movement data into operational workflows of water utilities for field/operations engineers was investigated. Proposed mock-up dashboards were well received with feedback taken to refine the concept (Figure 3). A cumulative displacement tool and deformation profiles can assist engineers to visualise how the ground is behaving around an asset. Other potential uses such as leakage detection which at present is heavily reliant on acoustic and visual inspections have also been proposed. Future operational development will include an early warning system to help determine an asset's failure risk using values calculated from the acceleration risk index.
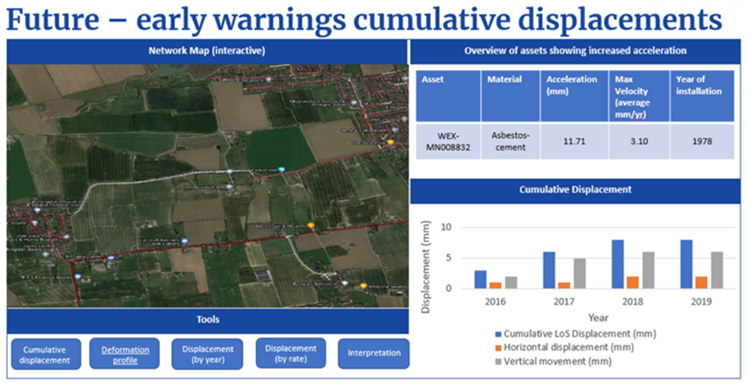
A potential method of integrating ground movement data into operational workflows is to provide an interactive and informative dashboard. Assets exceeding a set acceleration threshold would be designating a red colour indicating increased risk of failure. Users can then navigate to individual asset pages as illustrated to obtain specific details and use tools such as cumulative displacement to see when most movement occurred across a given time range. Developments are ongoing for this additional functionality of SatSense's DripIn project service.
SatSense is pursuing continued development with the DripIn project with a pilot phase planned to roll out with our partners before expanding the service within the UK and internationally. Our partners recognise long-term, strategic maintenance decisions and rapid response to events require high quality data streams. Innovative solutions such as SatSense's ground movement data and risk indices can reduce costs as water utilities face a challenging problem, inspecting and maintaining buried infrastructure vital to their clients, the general public.
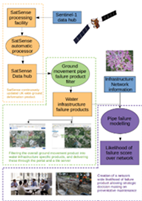
If you'd like to hear more or integrate this workflow into your company (figure 4). Please contact us at contact@satsense.com
Contact us today to hear how to implement this workflow into your existing pipe risk modelling software.