Detecting House Subsidence Using Satellites and InSAR

Friday, 05 June 2020

A member of the SatSense team was chatting to a neighbour one morning this week, and the neighbour mentioned his ongoing subsidence issues following the warm dry summer of 2018.

“Funny you should mention that…”

Having previously looked at the area around his own property and hence his neighbour’s house on our data portal, our man on the inside knew there were likely to be issues. His neighbour’s house showed signs of more movement than any other house within a few hundred metres and had often wondered what the effects were.


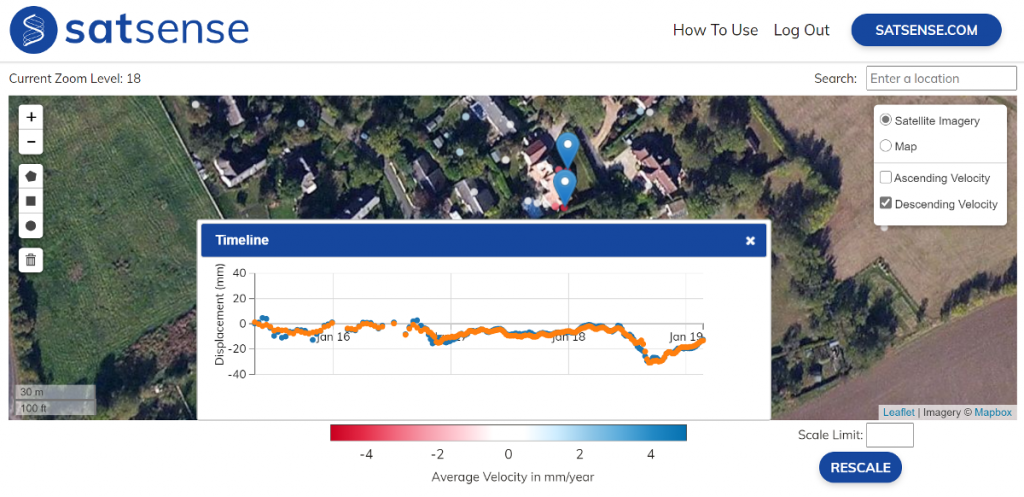
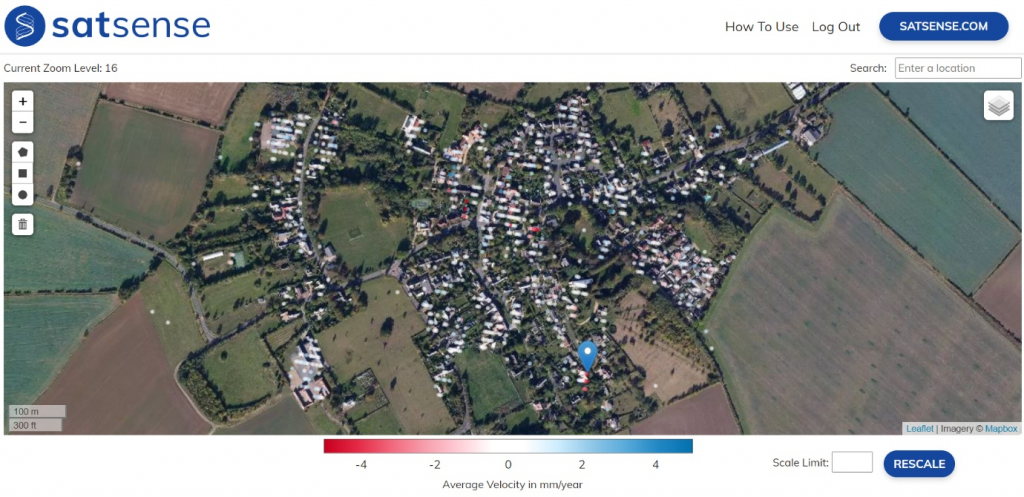
Satellite data showing >30mm movement at the house with subsidence issues, in less than a 3-month period


Insurance claim for subsidence


It turns out that the house owner and his insurers are mid-dispute over an insurance claim, with a significant amount of money at stake. Some of the cracking is shown in the images below.


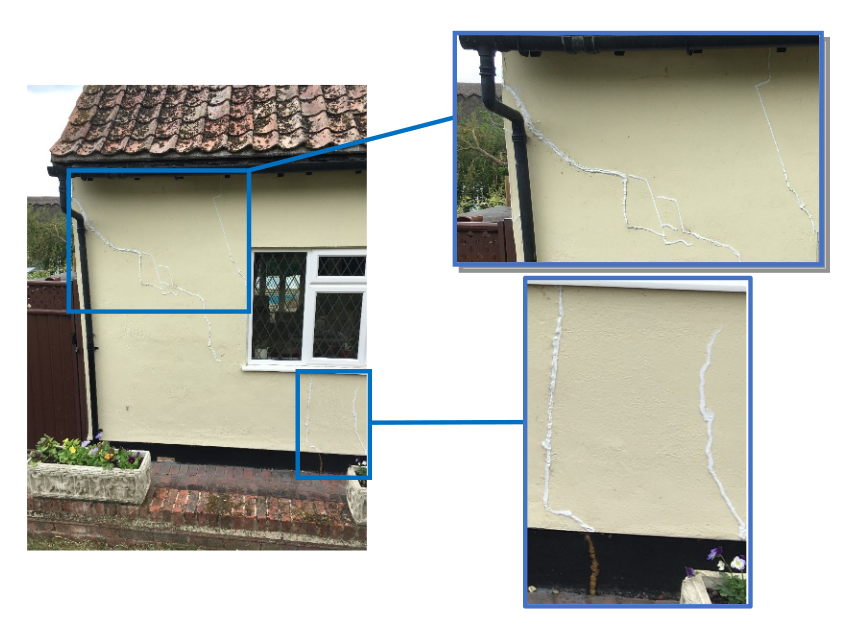
Cracks to one of the outside walls of the property in question


Given that the movement is represented as red dots on the data portal, i.e. ground moving away from the satellite while the satellite is on its ‘Descending’ trajectory relative to the earth (and while the satellite is on its descending trajectory it is facing towards the west) the movement is either down, or west, or both.

Upon examining the ‘Ascending’ data in the data portal (shown below) the house is represented by blue dots, meaning the ground is moving towards the satellite as it ascends (which is looking towards the east) - hence the ground is moving up, or to the west, or both.


Ascending satellite track showing slight ground movement towards the (east-facing) satellite, on or close to the house with subsidence issues


The difference in magnitude between the Ascending and Descending data indicates that the movement is likely both westward and downward. For Ascending, down and west cancel each other out (one is away from the satellite, the other towards). For Descending, they add (both are away from the satellite). Westwards and downwards in this case makes sense, as the house is on a slight hill, with west being further downhill – but this can be verified as below.


Combining data from two satellite trajectories to calculate east or west movement


Interestingly, one of our products, which combines the readings of two satellites and uses the look-angles to calculate East-West movement (shown below) separately to up-down movement also picks this out as an area of concern.


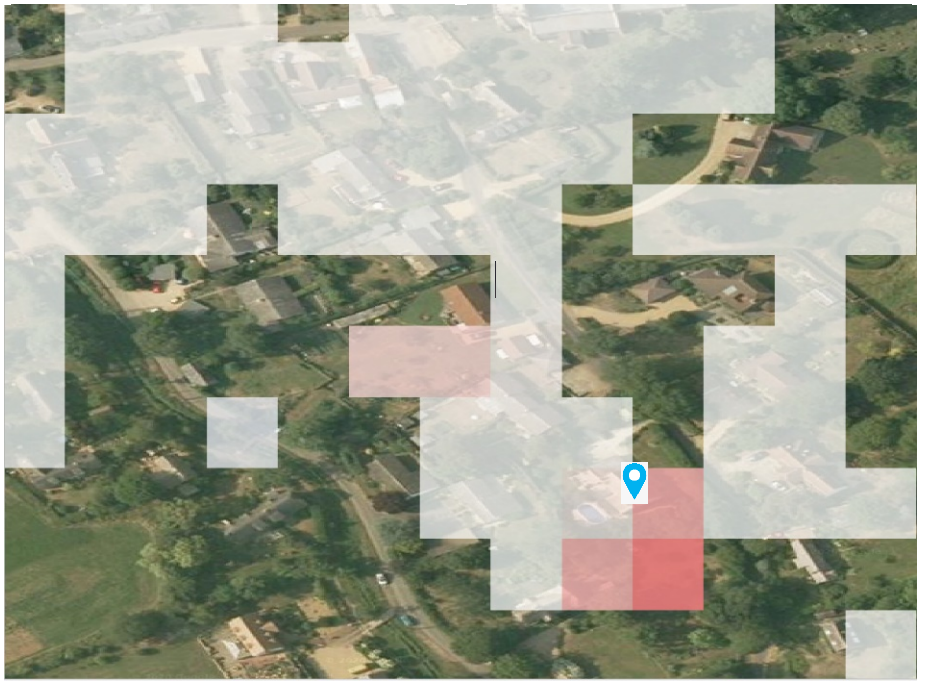
One of SatSense’s data products showing East / West ground movement, in this case the house is at a juncture of stationary and west-moving ground


The house is between ground that is moving and ground that is stationary - the area that is most prone to bending, and thus building damage.


Widespread subsidence coverage


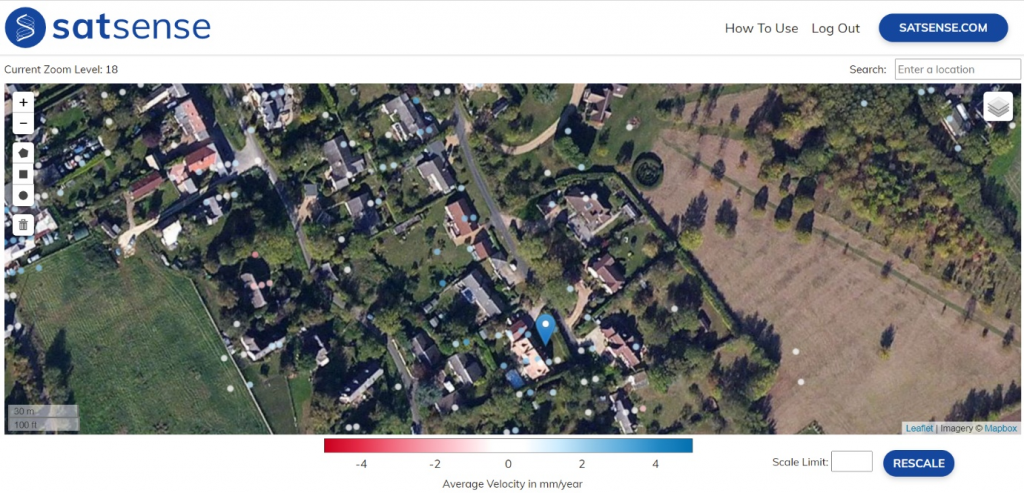
Looking on a larger scale across the village (shown below) while it’s clear that not many properties display such clear signs of movement, there are at least three more which do show clear signs of movement following the warm dry summer of 2018.


Basic subsidence / heave point coverage of a ~1km2 village, Descending data only shown


There are however two things to note; firstly that a seemingly clear subsidence or heave signal does not definitely mean subsidence issues. And secondly, that if there is no clear signal in the data as presented below, that does not necessarily mean there won’t be subsidence-related issues.


Another means of detecting potential subsidence


To detect subsidence and heave using InSAR data, it may be necessary to look at the data in more detail. For this reason, we have developed a series of property subsidence risk indices which consider factors such as bending, range of movement and acceleration which are difficult / impossible to pick up from the data as presented above.

Maybe if buyers, and just as importantly insurers were better informed of these sorts of risk, the sort of stressful dispute being experienced in the example above could be avoided.

If you think SatSense’s data and analysis could be of use to you please get in contact@satsense.com.

 
SatSense Santa Tracker: Bringing Christmas Magic to Your DoorstepThursday, 05 December 2024 SatSense and Zonguldak Bülent Ecevit University Partner to Revolutionise Ground Movement Monitoring in TürkiyeTuesday, 23 July 2024 SatSense continues to support STEM students to drive innovationWednesday, 08 May 2024 Are UK water companies prepared for another record-breaking summer?Friday, 23 February 2024 Monitoring Rail Infrastructure Using InSARWednesday, 07 February 2024 Revolutionising Infrastructure Monitoring Using InSAR DataThursday, 01 February 2024 SatSense Gets Contract for the DRIPIN Demonstration ProjectWednesday, 24 January 2024 How can asset managers get the most out of InSAR? Monday, 21 August 2023 How can InSAR data be used in GIS software? Monday, 21 August 2023 7 Reasons Why Civil Engineers Should Be Using InSARMonday, 21 August 2023 SatSense and GNS Science Partner to Revolutionise Ground Movement Monitoring in New ZealandThursday, 20 July 2023 Do Onshore Wind Farms Come with Geotechnical Risk?Thursday, 22 September 2022 Our Water Networks Handled the Heat Last Time But What About the Next?Thursday, 11 August 2022 Analysing Bridge Movement Using Satellite DataFriday, 06 May 2022 To What Extent Can We Monitor Ageing Infrastructure?Tuesday, 03 May 2022 The Climate Change Challenge Facing Rail InfrastructureWednesday, 27 April 2022 Keeping Rail Asset Management on the Right Tracks with InSARWednesday, 06 April 2022 Remotely Monitoring Ground Movement for Water UtilitiesTuesday, 22 March 2022 A Damming DilemmaThursday, 10 March 2022 How Can Asset Managers Remotely Monitor Ground Movement?Tuesday, 08 March 2022 Using InSAR to Monitor Assets in Remote LocationsMonday, 28 February 2022 Overcoming Site Monitoring Challenges with InSARWednesday, 23 February 2022 Project Update: Using InSAR Data to Monitor Disused Coal Tips in WalesFriday, 28 January 2022 How Can Remote Technology Aid Tunnelling Engineers?Thursday, 13 January 2022 What Did 2021 Look Like for SatSense?Monday, 20 December 2021 Using InSAR to Monitor Rates of Coastal ErosionWednesday, 15 December 2021 Is it Time to Ground the Extraction of Groundwater?Tuesday, 30 November 2021 SatSense Appoints John McArthur as Chairman to Prepare for Further GrowthTuesday, 30 November 2021 Dam Important DataTuesday, 05 October 2021 Real Time Data Dashboards and the Future of Smart Asset MonitoringTuesday, 05 October 2021 LiDAR vs InSARMonday, 23 August 2021 SatShop Delivers Ground Movement Data at the Click of a ButtonThursday, 29 July 2021 The Light at the End of the TunnelWednesday, 21 July 2021 Join SatSense – we’re hiring!Thursday, 15 July 2021 Analysing movements of the UK’s railway with Network RailThursday, 24 June 2021 Using satellite data to reduce water leakageMonday, 19 April 2021 SatShop portal FAQ’s Friday, 09 April 2021 Satellite data at your fingertipsThursday, 04 March 2021 Avoiding mining disasters with InSAR dataTuesday, 26 January 2021 Using SatSense data to accelerate your geotechnical desk studyWednesday, 16 December 2020 Water treatment works expansionWednesday, 09 December 2020 Using InSAR data to magnify insight in previously unsighted industriesTuesday, 24 November 2020 Ways to improve InSAR data coverageWednesday, 07 October 2020 Automatically detecting movement of infrastructureFriday, 31 July 2020 Getting ground movement direction out of our dataWednesday, 08 July 2020 Creating the SatSense Data PortalTuesday, 07 July 2020 Detecting House Subsidence Using Satellites and InSARFriday, 05 June 2020 Risk indices for detecting ground movement issues using InSARMonday, 01 June 2020 Detecting sinkholes from spaceFriday, 08 May 2020 How SatSense stays ahead of the curveThursday, 07 May 2020 Matt reflects on joining SatSense and says a bit about himselfWednesday, 22 April 2020