Improving our spatial coverage
Radar offers the chance to monitor ground movement over huge areas at high resolution. A key part of deriving measurements of ground movement from radar images is the identification of reliable data points. Reliable data points are not significantly affected by various noise sources in the data or errors. For example, a data point on a building is likely to be reliable as the building acts as a well-behaved reflector to the radar: it always reflects the radar signal back to the satellite in a very similar way. In contrast, trees are very inconsistent reflectors, as their canopy moves randomly in the wind between each radar image.
During our processing, we identify reliable data points and only use these to derive ground movement information. We’re always seeking ways to extract as much useful information from the radar data as possible and have recently made some changes to our processing which has resulted in much greater coverage in certain circumstances.
1) Improving coverage in rural areas
We’ve adapted our processing to better handle terrains which behave differently through time. Some areas may be reliable for part of the period covered by our data, but unreliable at other times. Previously, we required points to be consistently reliable throughout the entire observation period (2015 onwards). The changes we’ve made allow for these changeable data points to be included in our data for the periods when they provide reliable data. This has resulted in significant increases in coverage in some rural areas. The example below shows the improvement in coverage seen across part of the Scottish Highlands as well as moorland to the south east of Edinburgh.
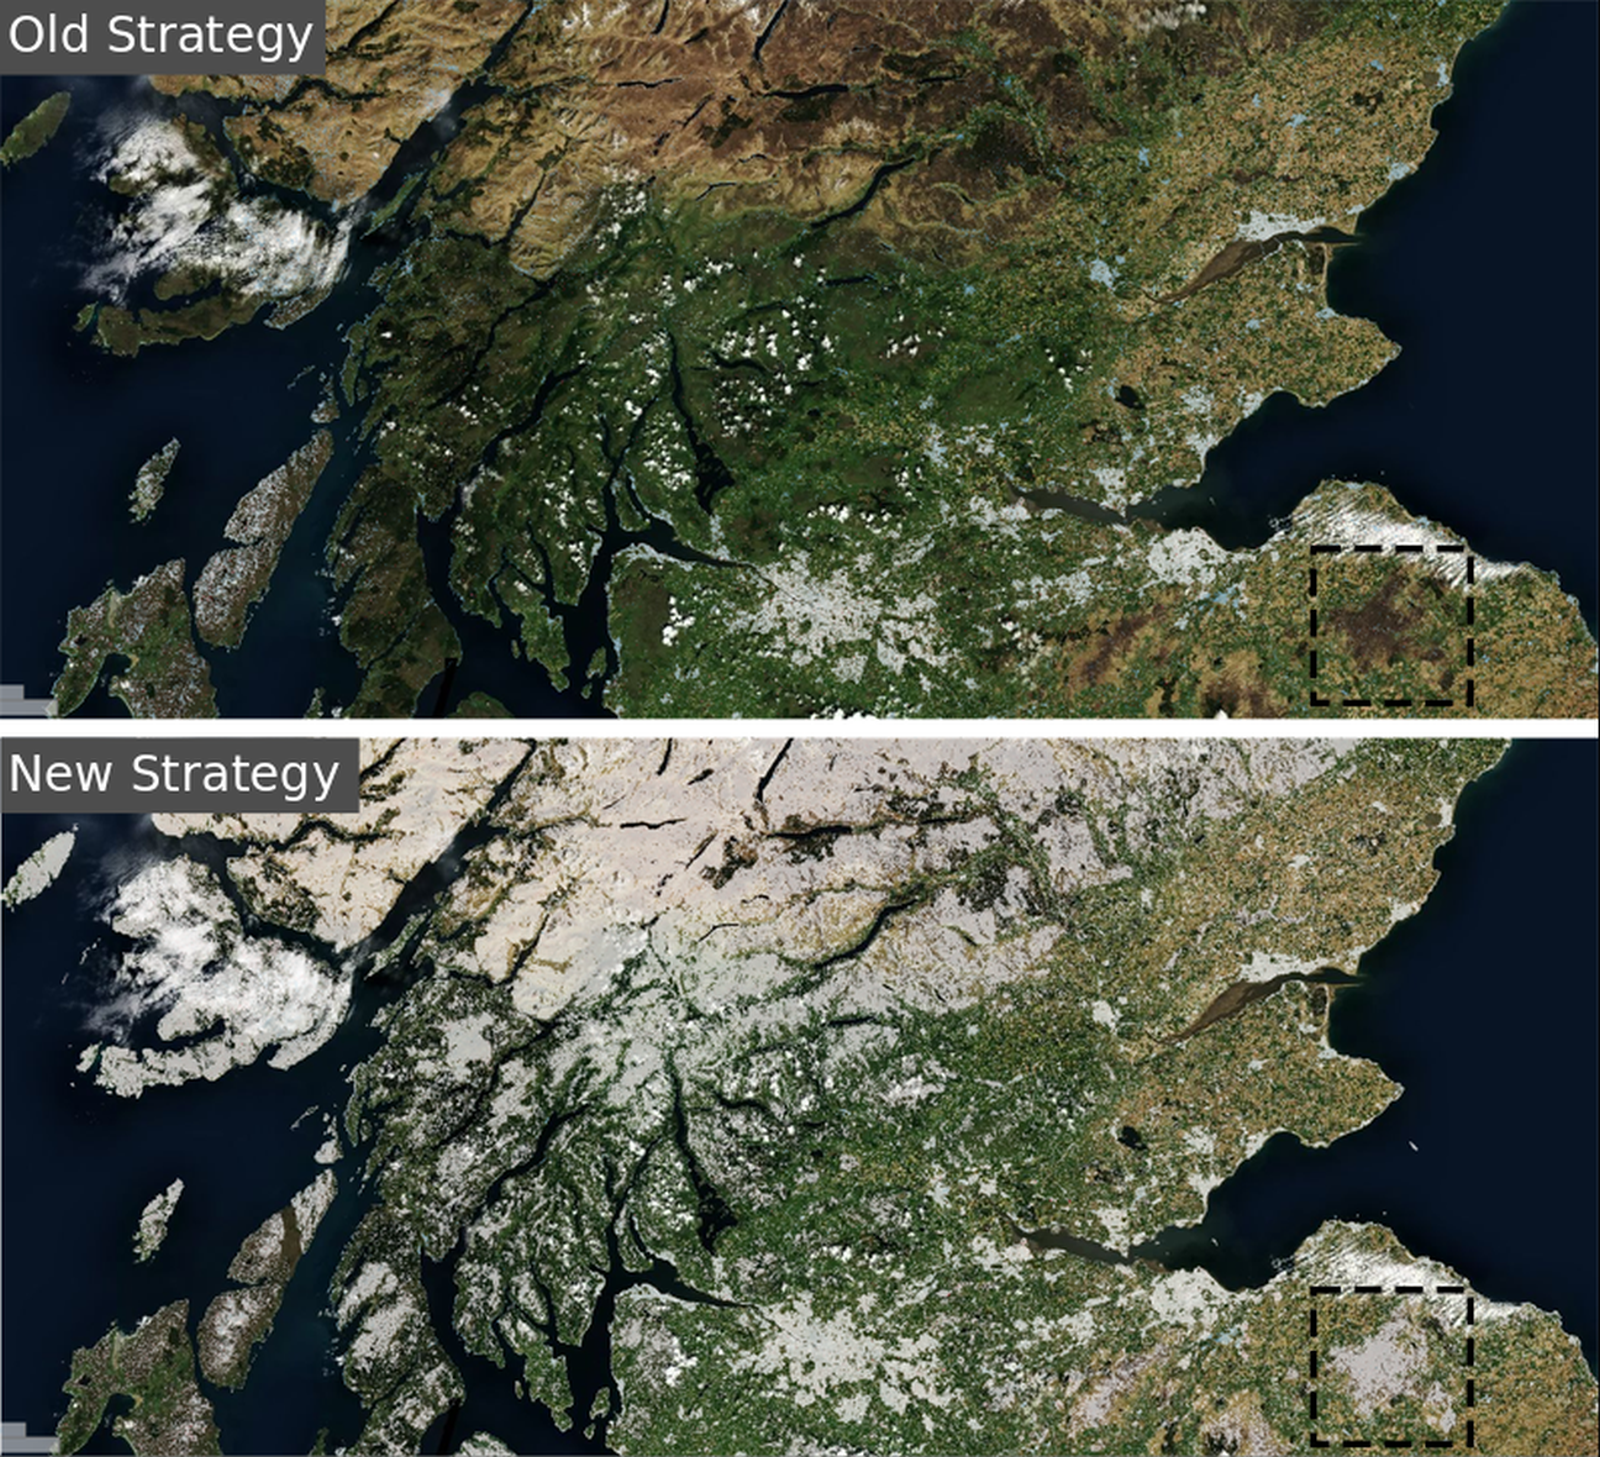
Figure 1: Top image shows coverage from our previous processing strategy over part of Scotland. Lower image shows the same area with results from our new processing strategy. Black rectangle highlights change in coverage over moorland.
2) Handling unwrapping errors to improve coverage
One part of the processing chain involves phase unwrapping. This is analogous to counting contour lines to determine the height of a hill on a map. Unwrapping errors occur when this ‘counting’ process goes wrong: a bit like missing one of the contour lines when you count them up on the map. We automatically detect these unwrapping errors and exclude points which are affected by them. This can sometimes lead to areas with much lower coverage than expected. Figure 2 shows an area in central London where one of these errors caused lower coverage than anticipated. Improvements we’ve made to the processing means we can try to correct these erroneous points rather than removing them, resulting in better coverage.
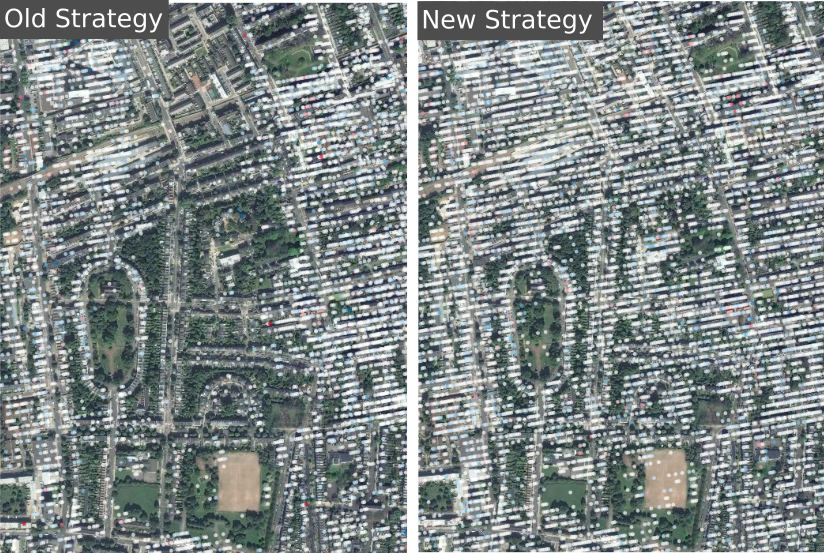
Figure 2: An area in central London affected by an unwrapping error. Left panel shows how this error causes a reduction in coverage, and right panel shows the improvement obtained when these errors are handled in our new strategy.
3) Including more data
We’ve processed more data from overlapping satellite tracks, increasing the density of points in areas of overlap and covering more of the UK. Combining data from multiple satellite tracks provides greater insight into the nature of any ground movement seen, as well as increasing confidence in consistent signals. The figure below shows an example over central Ripon, comparing the measurements made using one satellite track with those made from four overlapping satellite tracks. Most of the UK has this level of overlap, meaning a significant increase in coverage and point density, and these data are gradually being uploaded onto our portal.
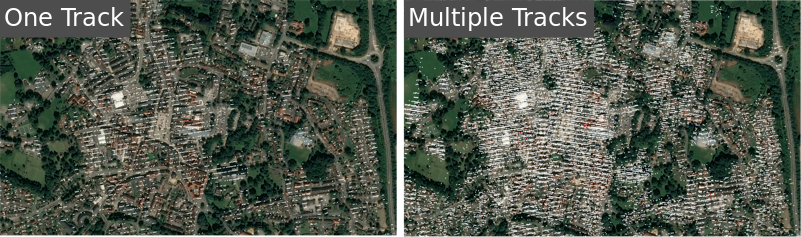
Figure 3: Comparison between data from a single track and data from four overlapping satellite tracks in central Ripon.
To explore our ground movement data for yourself, log on and explore our portal for one month no obligation trial at https://portal.satsense.com/ or to engage directly with one of our enthusiastic specialists email us at contact@satsense.com/.