Vital infrastructure networks in the UK require monitoring and maintenance, but the size of these networks makes the task challenging. Across the UK there are over 20,000 miles of railway track, and nearly 250,000 miles of roads. Traditional methods for monitoring these networks require the use of in-situ sensors or regular inspections by professionals, limiting the amount of the network that can be monitored at any one time.
Satellite remote sensing provides options for network wide monitoring from space, without the need to visit sites or install sensors. Optical satellites can provide regular, high resolution images of the network. Radar satellites can be used to generate digital elevation models (DEMs) and detect changes in all weather conditions. Radar can also be used to detect ground movements as small as a millimetre per year, allowing movement on or around infrastructure networks to be monitored remotely using InSAR. SatSense specialises in using InSAR to detect these small ground movements and providing the data to a variety of sectors in the UK and around the world.
The challenge of big data
InSAR can play a significant role in monitoring large infrastructure networks. Whereas sensors such as GPS provide point measurements of movement, InSAR provides movement data over much wider areas. Satellites like Sentinel-1 can produce measurements with a 4 x 14 m footprint over the whole of the UK. This wide area coverage can place sensor-based measurements in context. For example, a GPS sensor may show a section of railway line is subsiding, but is this part of broad subsidence associated with groundwater movement, or more localised settlement of the track? InSAR can provide valuable context and complement measurements obtained by other means.
In other areas, InSAR can provide movement data where there are no other in-situ sensors. This could be used to target future maintenance or monitoring efforts by identifying areas at risk of movement. At SatSense, we regularly update our data as new images are acquired by Sentinel-1 every 6 days. This means InSAR can be used for ongoing, near-real-time monitoring at network-wide scale.
However, the huge amount of data produced by InSAR raises a different problem. If the whole network can be monitored on a near-real-time basis, the amount of data that needs to be analysed quickly becomes very challenging! It would be impossible to manually inspect InSAR data associated with every mile of track or road or pipe across the UK every 6 days. Fortunately, we can try to replicate the features an experienced InSAR user might pick out as significant using some carefully designed metrics. These are designed to pick out particular patterns in the data, either in space or time or both. Some examples of these metrics, designed for the property sector, are shown here.
A rail network example
The line between Birmingham and London Marylebone has been affected by landslides near the tunnel at Harbury in both 2014 and 2015, causing delays and line closures[1]. The satellite image below shows how the landslip has been repaired and measures put in place to stabilise the site. Sentinel-1 can be used to monitor any continuing movements and inform monitoring of this site.
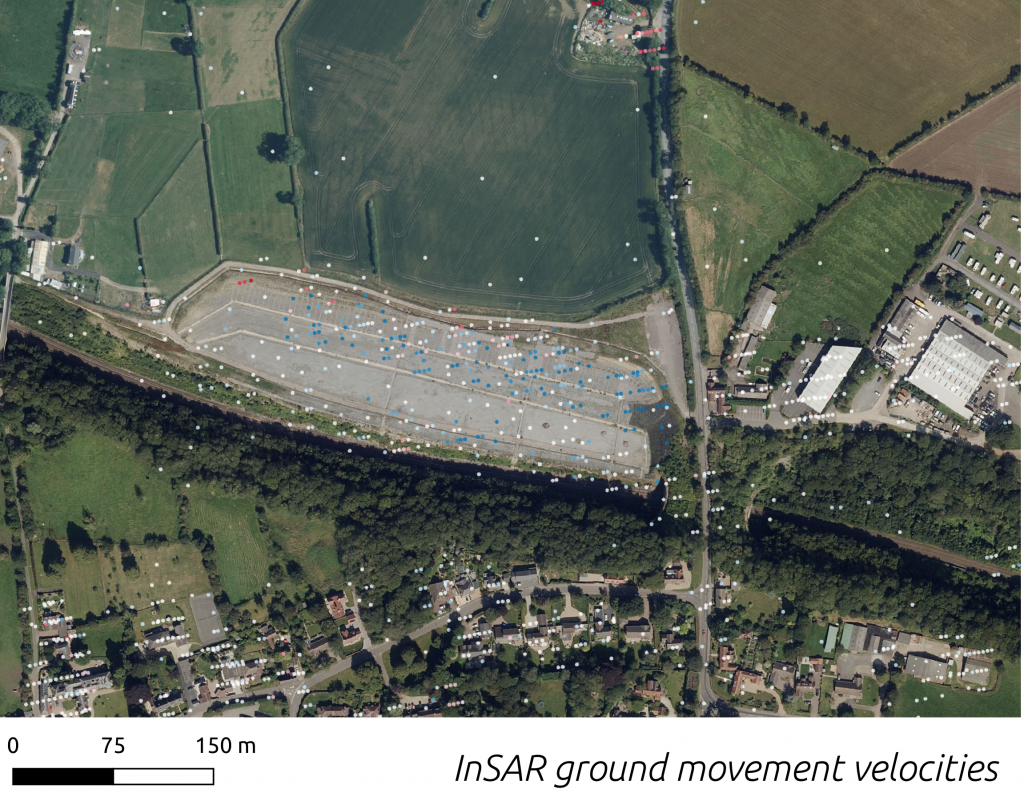
The picture above shows the average rate of movement for InSAR data points around the Harbury landslip. Blue dots indicate the points are moving towards the satellite, which is consistent with the landslide continuing to move towards the track. How would this kind of movement be flagged by our automated metrics?
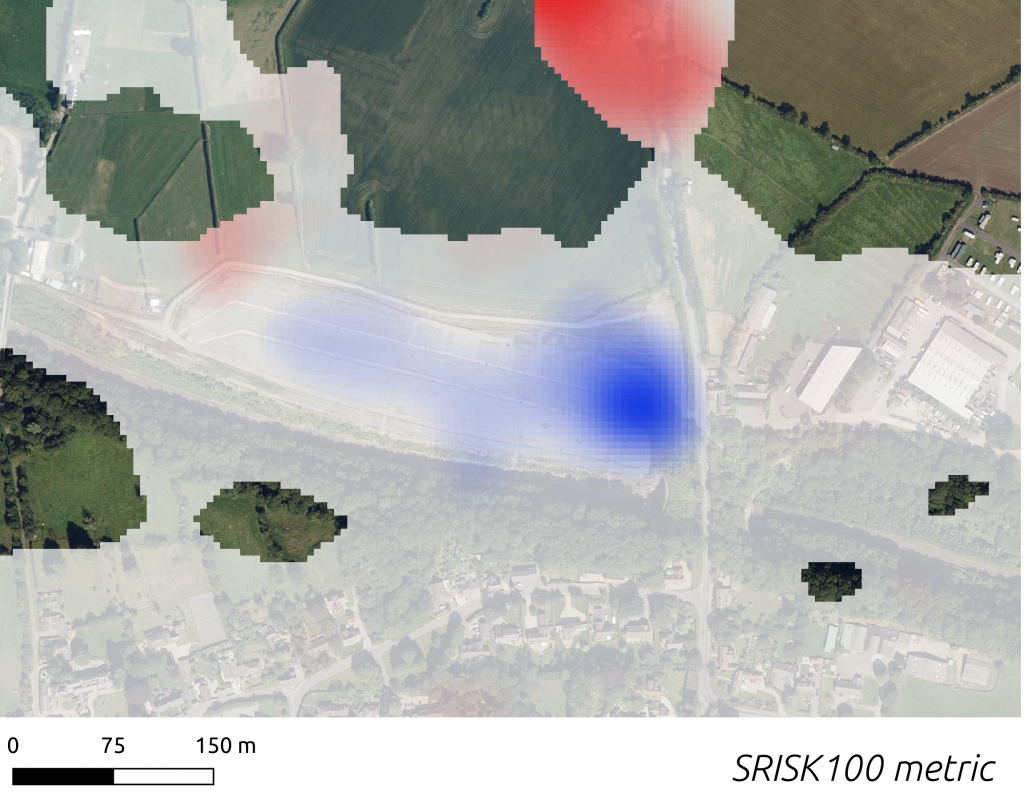
The figure above shows how one of our metrics, SRISK100, appears in this area. This metric highlights areas where movement is consistent over a length scale of approximately 100 m, and the landslide appears as a blue ’blob’. Metrics like these can be used to find areas of interest over the network. In fact, we only found out about the Harbury landslide because these metrics highlighted it for us!
A scalable solution
Whatever the size of the infrastructure, InSAR can provide useful information. This post has shown how InSAR can be used to detect large landslides like the Harbury slip, but smaller events can also be detected, such as subsidence on an individual property or the development of sinkholes.
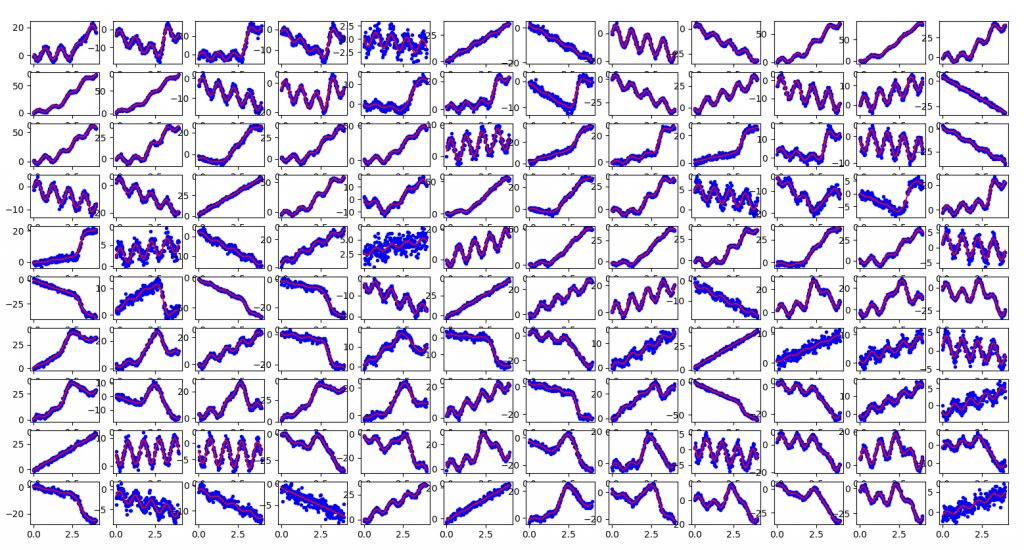
InSAR data contain a wealth of information, and we’re always happy to develop new metrics for extracting useful information for whatever infrastructure or project you need to monitor. The figure below gives an example of the kinds of movement InSAR can detect as blue dots: seasonal signals, transient events, steady motion and combinations of all three! The red line shows a model we can fit to the data to extract parameters of interest and draw out the useful, significant signals from any background noise or nuisance signals.
Contact us today to discuss any infrastructure you need to monitor, and how InSAR data could provide valuable insight - contact@satsense.com.
https://www.networkrail.co.uk/who-we-are/about-us/#:~:text=Network%20Rail%20owns%2C%20operates%20and,signals%2C%20level%20crossings%20and%20stations.
[1] https://www.bbc.co.uk/news/uk-england-coventry-warwickshire-26191090
https://www.bbc.co.uk/news/uk-england-oxfordshire-31081630